

By now you should know that a faster website makes your clients happy, they buy more, and they engage more with your content. However there's one client in particular that likes fast websites, and that's Google! Fast websites rank higher in organic search results than slower websites. Fast websites will also achieve higher quality scores in Google Ads resulting in lower ad spend.
We've previously written about Google's Web Vitals, and how Google will be using them as search signals from May 2021. You might have wondered though, how will these web vitals be determined? Will they be gathered by the Google Bot? The answer is no, it turns out that Google has another method, and they've been working on it for several years.
Introducing the Chrome UX Report (CRuX)
The CRuX report is a public data set of real-user measurements (RUM) of website performance across millions of sites. The report has been around since 2017 and is updated daily, but until recently the data has been difficult to access.
The data is collected from real Chrome browser users who have opted in to report back to Google information on their browsing. This opt-in requires that the user has:
- Opted in to syncing browser history
- Have not set up a sync passphrase
- And have usage statistic reporting enabled
Despite these conditions, there are still millions of Chrome users reporting back their statistics to Google, however a given website will have to be fairly busy before there are decent statistics in the report.
Gathered Metrics
Apart from the Web Vitals the report also gathers the following event timings:
- DOMContentLoaded: when the main document has been loaded
- onload: when a page and all its associated resources have been downloaded and parsed;
Dimensions
As performance can vary widely, the metrics are divided into the following dimensions, to help segment and understand the user experience.
- Country
- Device Type: Tablet, Phone, Desktop
- Connection Speed: slow 2g, 2g, 3g, 4g, or offline
Viewing data in the report
There are several ways of seeing how your website performs in the report. These include:
Pagespeed insights
Google's website analysis tool provides summary CRuX data for the analysed URL and also for the entire site in its results, if data is available.
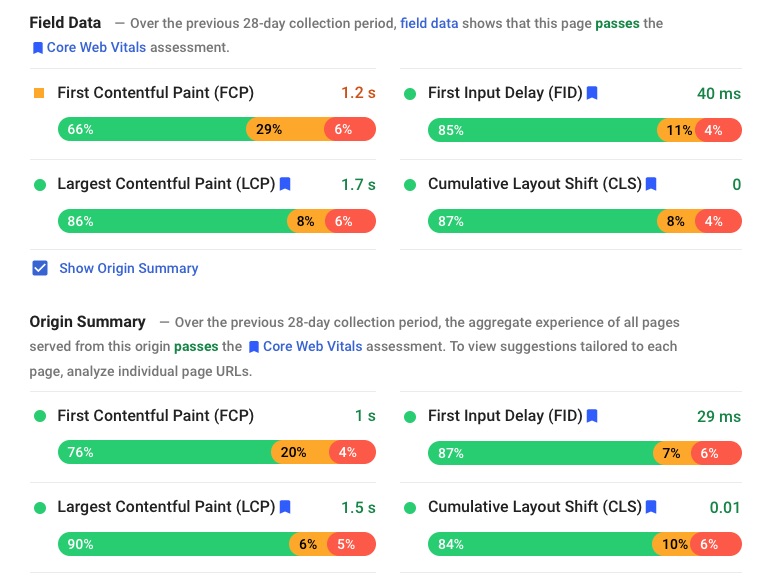 Page Speed Insights Field Data" style="max-width: 100%;margin-bottom: 20px"/>
Google BigQuery
The most flexible way is to directly access it via BigQuery. You use SQL (database query language).
The downside is that you have to have an understanding of SQL to use it, as well as a Google account.
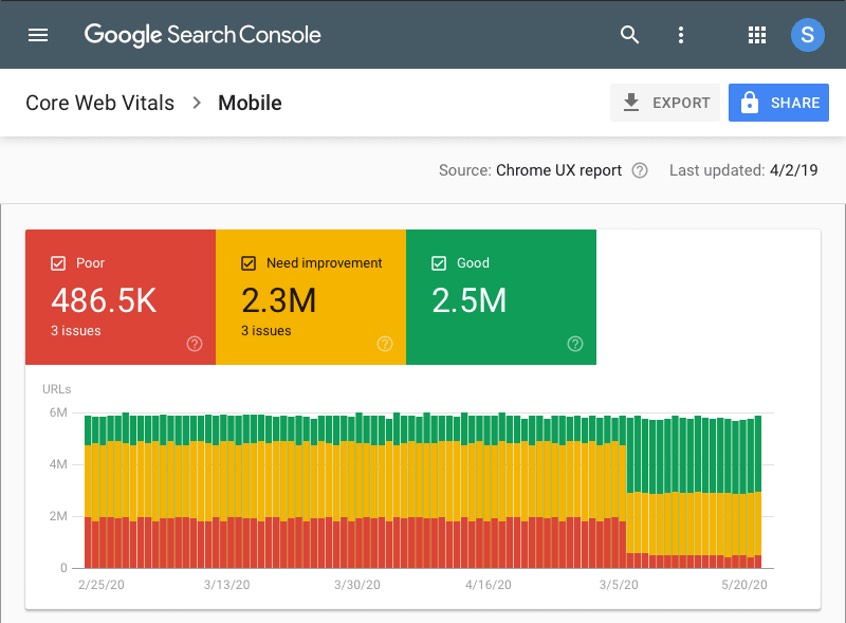
Google's Search Console (formerly Webmaster Tools)
The search console now has a section 'Core Web Vitals' that provides basic information on whether URLs pass the Core Web Vitals or not as well as a nice historical graph of performance for both mobile and desktop.
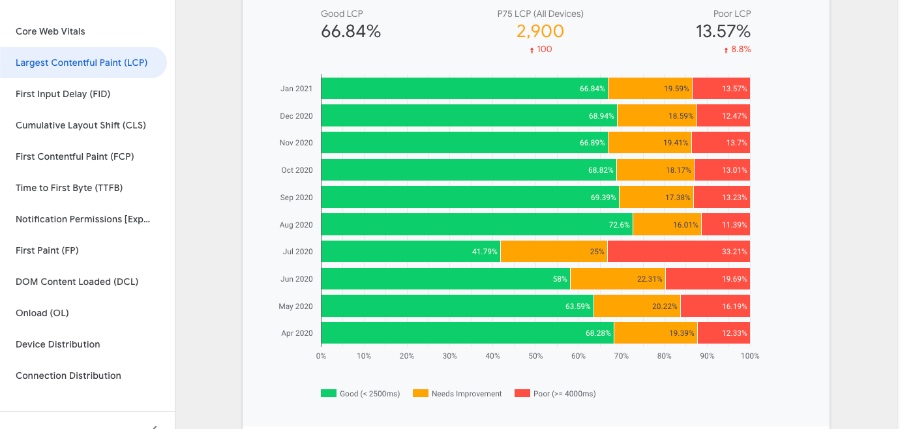
Google's Data Studio
Data Studio is a data visualisation tool that lets you build dashboards on top of the CrUX report (amongst other big data sources). It enables you to easily create a cool visualisation of the performance of your (or someone else's) website over time.
Third party tools
Like our very own competitor speed report! This uses the Chrome UX API to retrieve the information.
Conclusion - Why you should care
The data in the Chrome UX Report is how Google sees the performance of your website. It is also a free source of real-world user measurements of your website performance, which is invaluable information for you to gauge how users see your website. If you want your site to rank well and to lower your ad costs then your website must pass the Web Vitals, and the source of truth is the Chrome UX Report.