What is an Account-Control Surface?
Understand the account-control surface and why account protection has to cover more than the login form.
Support FAQ
Speed Index is a web performance metric invented by WebPageTest developers in 2012, and measures how quickly visual content is displayed as a website page loads. As speed index is actually measuring what an end user sees in their browser, it is a much better indicator of user perceived performance that metrics like the dom load or page load event.
As the website being measured is loaded, a series of screen shots are taken as content is loaded. Each screen shot is then scored for visual completeness 'above the fold' using the following formula:
Interval time * (1 - visual completeness/100)
The score for each frame is calculated until all content is displayed and then all the scores are added to give you the speed index, the lower the score the better.
Here's an example with a 500ms interval:
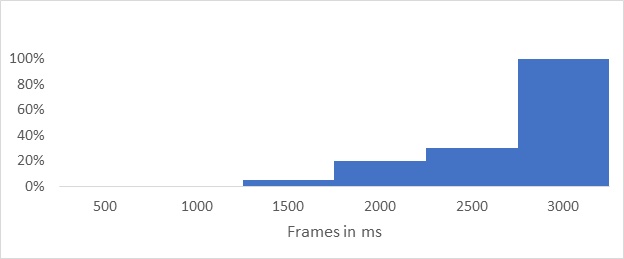
| 1. | 500 * (1 - 0/100) | = 500 |
| 2. | 500 * (1 - 0/100) | = 500 |
| 3. | 500 * (1 - 5/100) | = 475 |
| 4. | 500 * (1 - 20/100) | = 400 |
| 5. | 500 * (1 - 30/100) | = 350 |
| 6. | 500 * (1 - 100/100) | = 0 |
Now adding them all up:
500 + 500 + 475 + 400 + 350 + 0 = 2225
If a site has content above the fold that is changing after loading, eg a hero carousel, or a marketing pop up, then the calculated speed index can be artificially high.
For a full technical overview of speed index please check out the official documentation.
Understand the account-control surface and why account protection has to cover more than the login form.
Learn about account takeover threats, protection strategies, and detection methods to secure your digital accounts and prevent unauthorised access.
An overview of Account Takeover Attacks
A practical reference for common AI crawler user agents, operators, purposes, and recommended Peakhour bot-management actions.
AI For Cybersecurity explains the concept in the context of AI security, with practical checks and mitigation considerations for site operators.
AI Image Generation explains the concept in the context of AI security, with practical checks and mitigation considerations for site operators.
© PEAKHOUR.IO PTY LTD 2026 ABN 76 619 930 826 All rights reserved.