

WebPageTest is one of our favourite tools for measuring website performance: webpagetest.org
WebPageTest was created and open-sourced by Patrick Meenan in 2008. Catchpoint acquired WebPageTest in 2020 and operates the hosted service. The official code remains available for teams that need to run their own instance, with licence terms that differ between its active and Apache branches.
The key advantage of WebPageTest is that tests can be run from locations around the world, using real browsers at actual connection speeds. That lets you test performance where your users are, and see real load times rather than arbitrary scores out of 100. You can run simple tests, advanced multi-step tests, video capture, content blocking, multi-site visual comparisons, and scripted multi-step journeys. While this is still a synthetic test, it is about as close to real-world performance measurement as you can get without using RUM.
Use WebPageTest when you need to understand why a page is slow. Use the Chrome UX Report when you need to know how real Chrome users experienced the page over time. Use Peakhour's website speed comparison tool when you want a fast comparison between your domain and competitor domains using CrUX field data.
Running a Simple Test
To run a simple test:
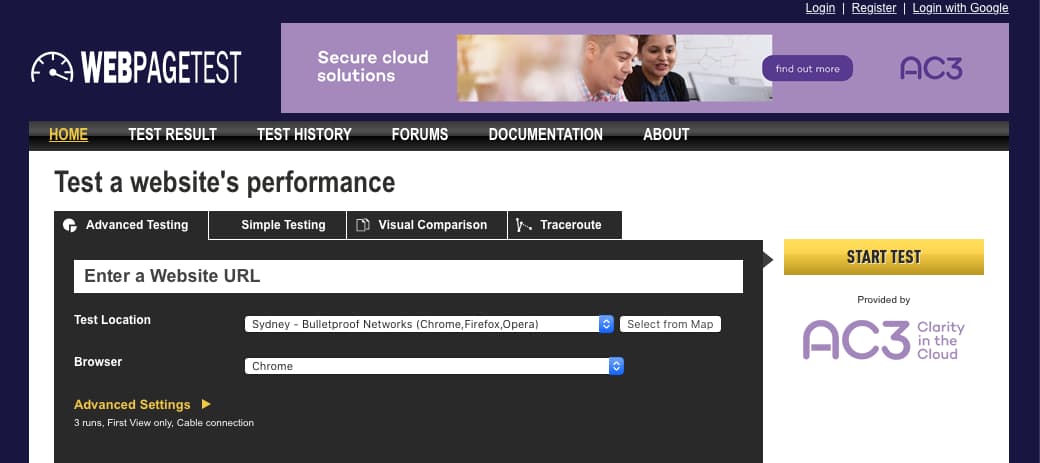
- Visit webpagetest.org
- Enter the URL of the page that you want to test in the 'Enter a Website URL' field. We usually enter only the domain name, with no www and no https:// at the front. This simulates someone typing your domain into a browser address bar and captures how much time any redirects add to the page load. Sometimes redirects can be very slow.
- Select the location of the test from the 'Test Location' drop down. Choose locations that reflect where your users are. Note Australian locations are at the very bottom.
- Choose the browser to run the test from. Chrome is the default.
- Press 'Start Test'
Note there are advanced options but for simple testing you don't need to change these.
The test will perform three visits to the specified page, with the browser cache cleared in between each visit. This simulates someone visiting your site for the first time, including the parts of the page load that only happen on an uncached visit.
Interpreting the results.
A,B,C's
The results page has a summary section at the top giving you summary grades for several categories. Here's a sample report using our website, peakhour.io. Take note of the sections at the bottom, because we'll refer to them later.
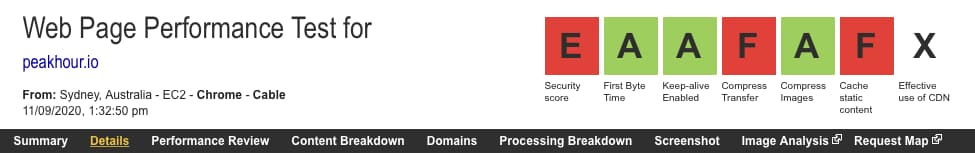
While this section isn't representative of performance it can still give you actionable information. Here's a summary of the information (ignoring security since we're concerned with speed):
First Byte Time: How long it takes the server to respond to the browser request with the first byte of information. This is the same as the Web Vital Time To First Byte (TTFB).
Keep Alive Enabled: A server option that leaves the connection from the browser to the server open for a short time, usually a few seconds, after the server has finished transmitting a request. This allows the browser to reuse a connection and saves time because it does not need to reconnect as often.
Compress Transfer: When files are transferred from the server they are compressed, usually via gzip, to make sure transfer sizes are as small as possible. It looks like we have a problem here.
Compress Images: Images are usually the largest part of a web page by transfer size. Making sure they're well compressed is important for fast sites.
Cache Static Content: Checks that static files, e.g. JavaScript, CSS, and images, have appropriate cache headers so your browser doesn't re-fetch them every time it views a page. We're developing our site so have caching turned off at the moment, hence the bad score
Effective Use of CDN: Detects whether your website is using a CDN known by WebPageTest.
This report points to problems with transfer compression and static content caching.
Performance Metrics (The Important Stuff)
The next section summarises the key performance metrics of the page load. Google's web vitals are represented alongside lab metrics such as speed index, total blocking time, and page weight.
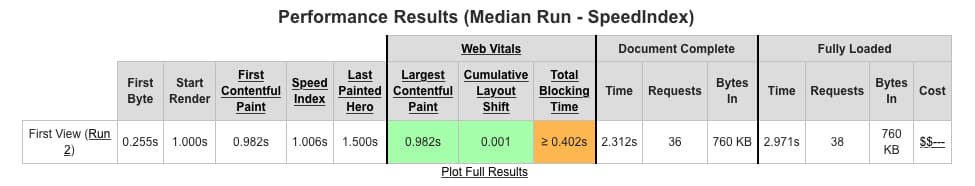
Despite some poor marks in the grading section, the peakhour.io website loads very quickly. Its Largest Contentful Paint (LCP) is less than 1s, well below Google's 2.5s target for a good result. We've already covered them in our web vitals, which also defines ideal values for each metric, so we won't cover them again here. One detail worth noting is that Total Blocking Time is still a useful lab signal for main-thread blocking. It is not the same as Interaction to Next Paint, because INP is measured from real user interactions in the field, but it helps identify JavaScript and third-party work that can harm responsiveness.
The Detail Section
Remember the sections immediately below the grade summaries? Now we're going to click on the 'Details' section. The part we want to highlight here is the Waterfall.
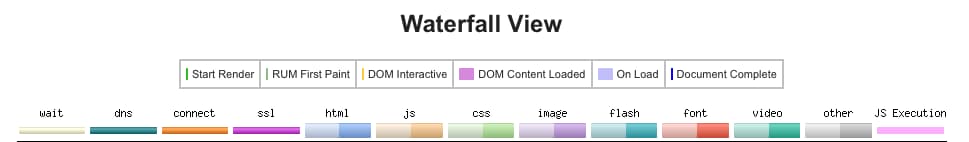
At the top of the waterfall chart is a colour key for reading the diagram. The key concepts are:
dns (Dark Green): This measures the time it takes for the browser to look up the location of your server.
connect (Orange): This measures the time taken to establish the TCP connection to download a resource. It should only appear on the first resource for a given host. Remember the keep-alives grade: if that is turned off, there will be more connections here.
ssl (Dark Purple): Any resources that are loading from a secure website will need to be processed as such – the purple will signify how long it is taking to connect to that SSL item.
The Waterfall View
The waterfall is an easy-to-read view of how your website loads, with all the resources listed in the order they're requested, along with the time taken to load each resource. You can click on any resource to view the request/response headers, file size, protocol and more.
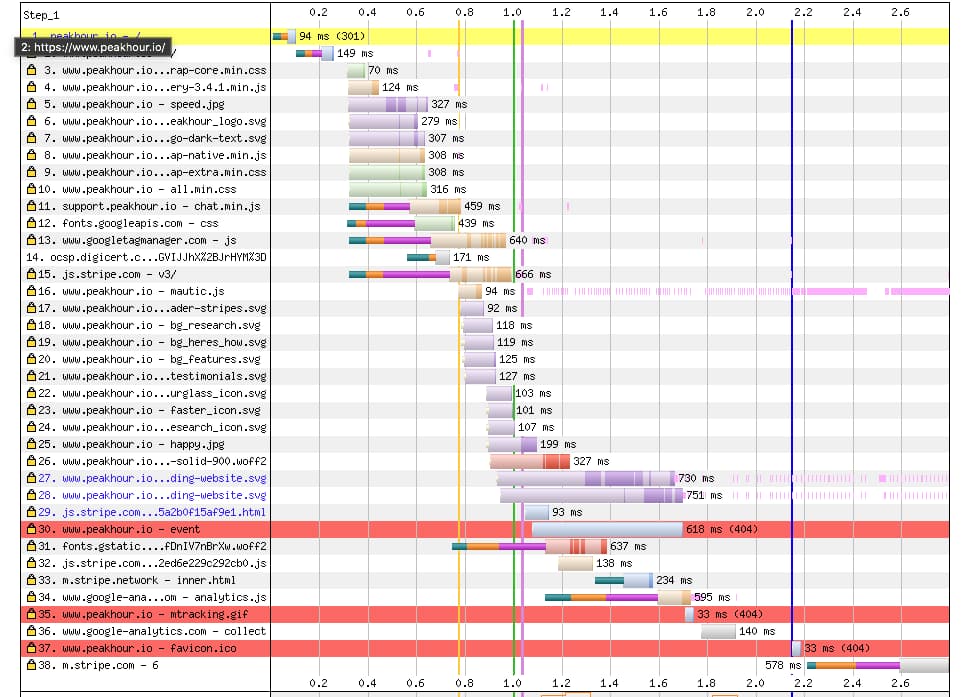
In the example above the first line has a yellow background, which signifies a redirect. The three lines towards the bottom with red backgrounds signify 404 not found errors, which need to be fixed. The colourful vertical lines indicate where major load events, like first paint and document loaded, happen.
The other thing to look for is any resource that takes a long time to load. In our example the 2nd row, which is the main HTML document, only took 149ms, which is fast. A lot of websites take 2-5s to load the main document, putting the user experience under pressure before the rest of the page has started. The main concerns here are rows 27 and 28: two SVG images that took around three quarters of a second to load.
The Performance Review Section
The final section we're going to cover is the Performance Review section.
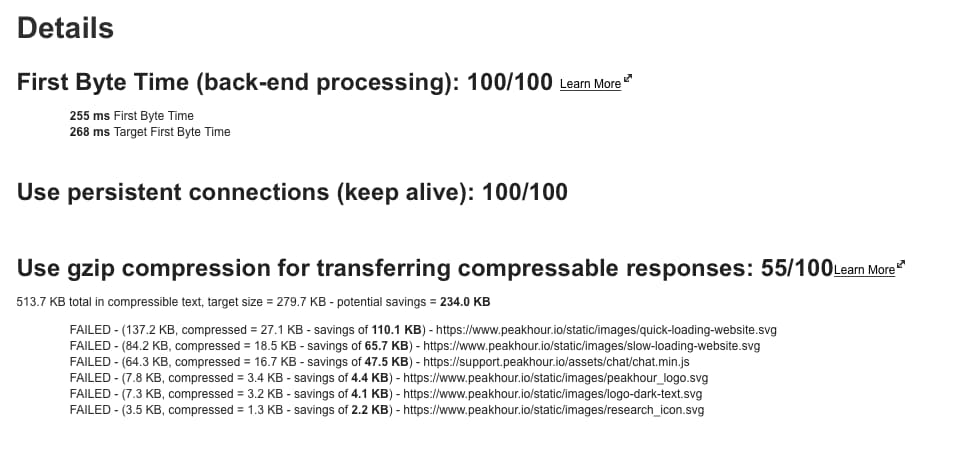
This section gives more detail for the performance grades at the top of the report. In the earlier example Peakhour.io scored poorly for Compress Transfer and now we can see why: we're not compressing SVG images, something that can save 234kb of file downloads.
Summary
WebPageTest gives you enough detail to see where a page is losing time, not just whether it passed a headline score. There is more in the tool than we've covered here, but this is enough to test a website, read the main report sections, and identify practical issues to fix. If you are starting with a market view rather than a single waterfall, compare your field data first with the website speed comparison tool, then come back to WebPageTest for the diagnostic pass.