

Today we're introducing our other favourite tool for testing website performance: Google Lighthouse (from here we'll just call it Lighthouse). Lighthouse measures page experience across accessibility, performance, SEO, and Progressive Web Apps for desktop and mobile devices.
Lighthouse is the engine behind web.dev/measure and PageSpeed Insights. It is also available in Chrome DevTools, via npm, or as a browser extension in Chrome and Firefox. At time of writing Lighthouse is up to version 6, which introduced Web Vitals as the basis for scoring. If you are unsure which version of the tool you are using, then scroll right to the bottom of the report it generates where it will state the version.
Lighthouse generates its report by simulating a specific device and network speed, rather than running at the full speed of your computer. That matters because speed issues are more noticeable on slower devices, and users are not all on newer devices or fast internet connections. You should test for a good load experience across that range. The current simulated mobile device is a Moto G4 on a ~1.5 megabit connection. For reference, it would take over 5s to download 1mb of data at this speed. If your page weight is typical, ie over 2.5mb, you should not expect a strong score.
How to use Google Lighthouse
There are two ways you can run a Google Lighthouse report:
- In your local browser;
- Online via web.dev/measure or PageSpeed Insights.
We recommend running Google Lighthouse in your local browser because the online versions operate out of the US. If your website and customers are elsewhere, that extra network latency can pull the score down.
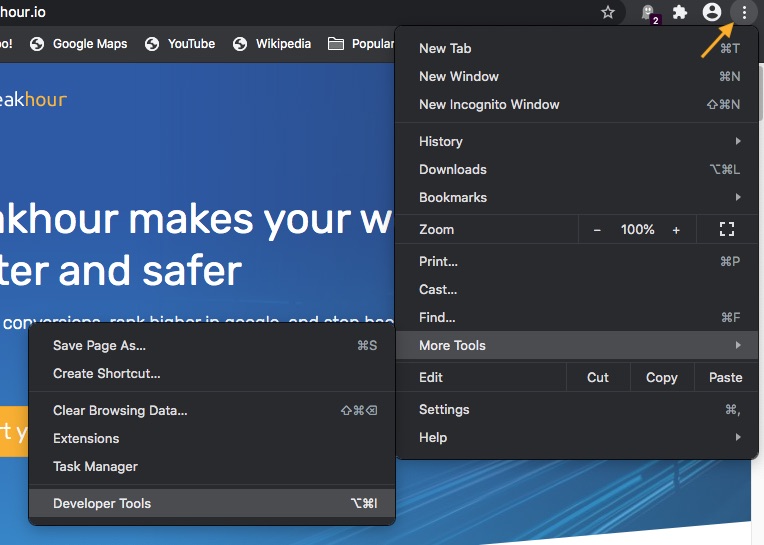
Here we'll focus on running Lighthouse from within Chrome DevTools. To do this, click on the three vertical dots in the top right-hand corner, then select 'More Tools', then 'Developer Tools'.
The developer tools will then be displayed. Along the top of the tools window are a number of tabs. Select the 'Lighthouse' tab.
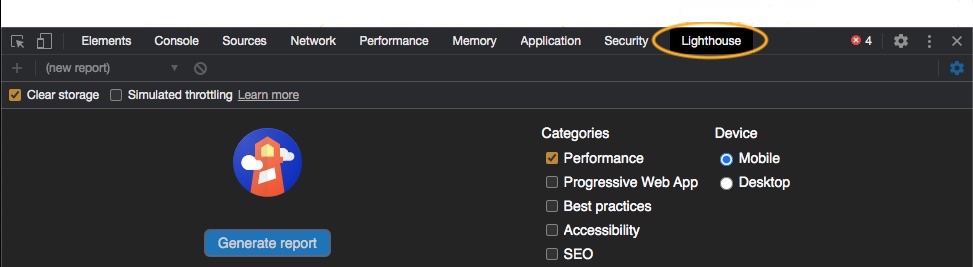
Since we're only interested in performance, make sure only the Performance category is ticked. You also want to make sure 'Clear storage' is ticked (in the top left) to simulate a first load of your site. Finally, choose the device you want to report on, mobile or desktop, and click 'Generate report'.
While the report is being generated, avoid doing anything else on your computer, and don't leave it busy with background tasks. Otherwise, the score can be affected.
Understanding the Score
Once the report has finished you'll see a performance summary, like this mobile one we ran on Peakhour.io while we were developing the website:
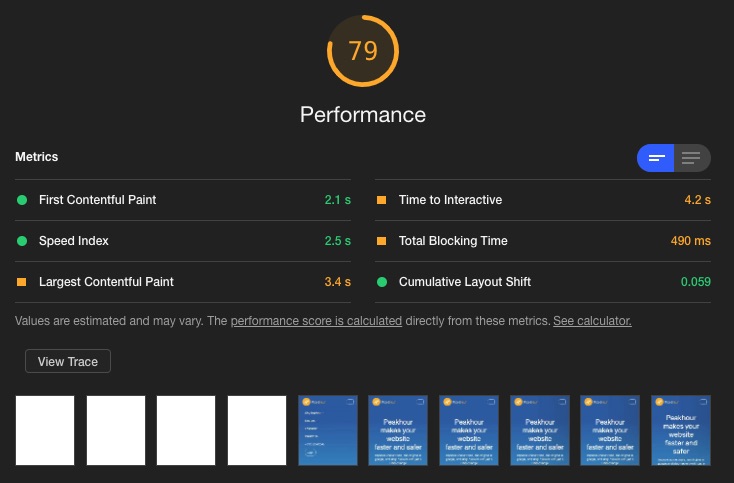
Scoring in version 6 is based on Google's web vitals, which are metrics that indicate a good user experience, and Webpagetest's speed index, which measures visual loading performance. Each metric is colour coded as good, ok, or bad. If the measurement is good you get a green circle to the left, if it's ok you get an orange square, if it is bad you get a red triangle.
Each raw metric (the number listed in the report) is compared to real website performance data sourced from the HTTP archive and converted into a score out of 100. This is done by grading the reference data on a curve, so if your website performs in the top 8% of websites, it gets a score of 90. Similarly, if it scores in the top 25%, it gets a score of 50. If you are interested in the technical details, Google has in-depth explanations of the scoring at web.dev
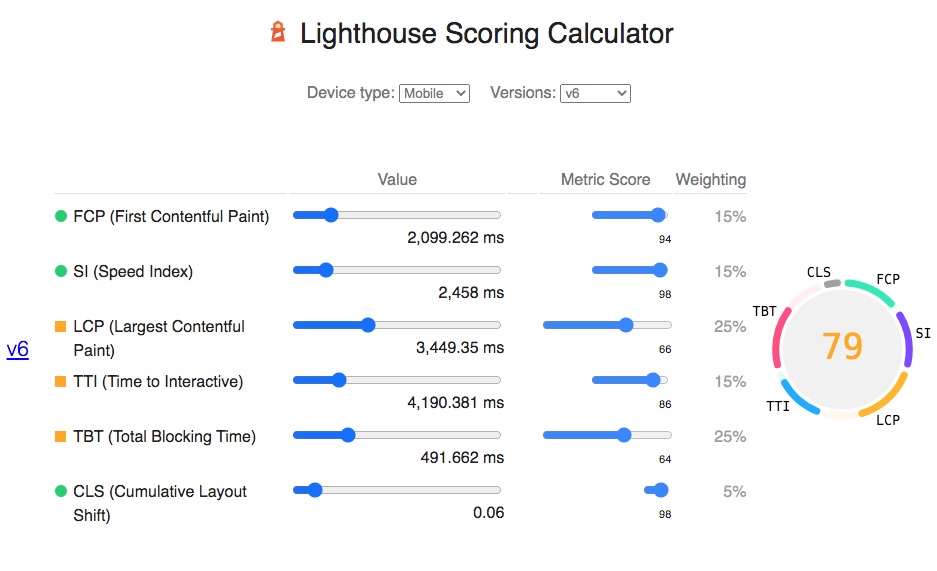
Each metric is assigned a weight, and the scores are tallied into one overall number based on the weighting. Here is a breakdown of the test we just ran (in the screen shot above), obtained by clicking on the 'See Calculator' link between the Metrics section and the screen shots:
Score Variability
79 is a good result for a mobile device. However, we ran it several times and obtained scores between 60 on the low end and 85 on the high end. Scores can fluctuate widely, even when testing on the same device repeatedly. Reasons for this include:
- Small differences in internet performance.
- Your computer CPU load when performing the test.
- Web server variability.
Again, Google has in-depth documentation around what might be causing this.
Opportunities
If your site loads slowly then Lighthouse will list addressable reasons in the opportunities section of the report.
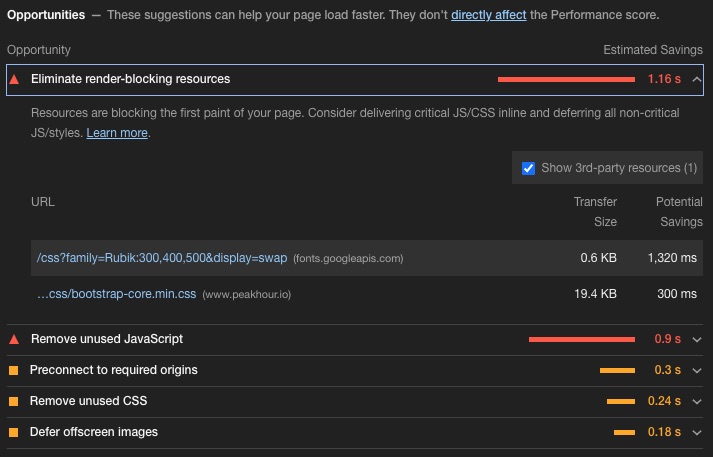
This is the part we generally find most useful. It identifies items that slow the initial load and items that affect the rendering of a website once it is downloaded. A page can be downloaded very quickly, but the end user still sees a slow site because CSS and Javascript are blocking rendering. This is a common problem in Wordpress and Magento themes. These themes include large amounts of third party code that ultimately never gets used for a particular site, but which the browser still has to download and parse before it can display anything.
In this case, the main bottleneck appears to be a font loaded from Google Fonts. This is delaying the rendering of our page by 1.3s.
Diagnostics
The diagnostics section provides additional information you can use to improve load times.
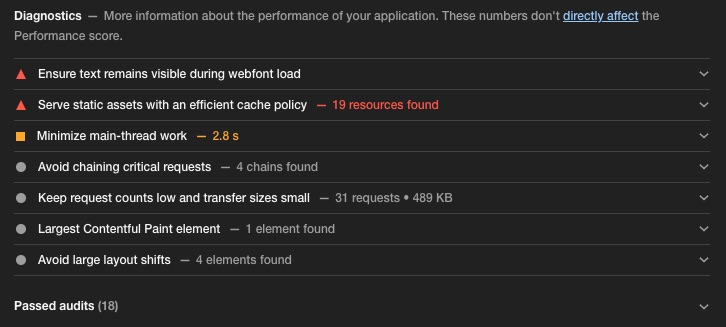
Here we have a few small problems, mainly associated with the development status of our site.
web.dev and PageSpeed Insights
If you do choose to run your report online, we recommend using PageSpeed Insights.
In addition to the generated report, PageSpeed Insights also shows you Field Data for the page you are testing, and an Origin Summary for all pages on the website.
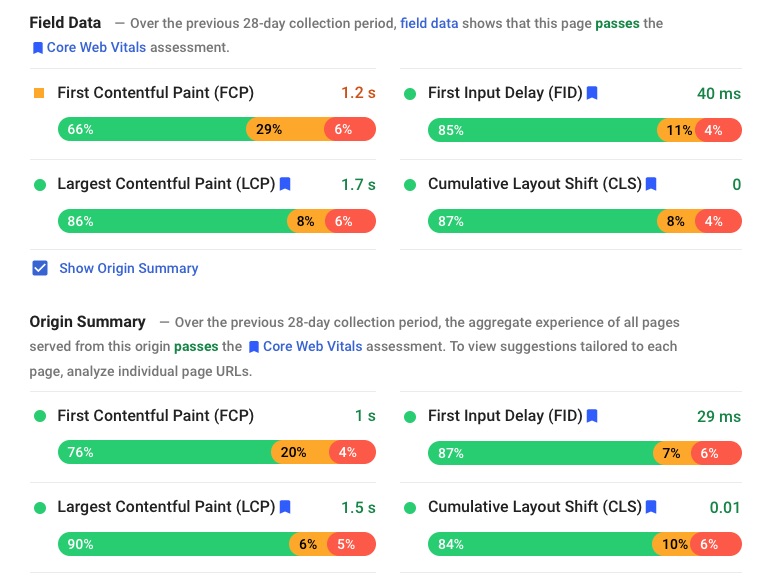
This is real-world data gathered from Chrome users who have opted in to allowing Google to gather their data. If your site isn't very busy then Google might not have any data to share. It is not truly representative, but it is useful information and can often tell a very different story to your Lighthouse score.
Summary
Regular measurement matters because performance issues are often specific and easy to miss. Lighthouse is useful for identifying issues that affect website performance, and when used in conjunction with Webpagetest.org, you'll be in a better position to provide a good experience for your users. Next we'll cover common issues that can impact site speed, so read on.