

Our last three website performance articles covered the why and how of testing website performance, and introduced our two favourite performance testing tools, WebPageTest.org, and Lighthouse. This article covers the common causes of slow loading times, and how to spot them using the same testing tools.
1. Latency
Latency is the time it takes for a request from a client's browser to traverse the internet to reach the website server. A number of factors affect latency, with physical distance usually the main one. Data on the internet travels at the speed of light, so distance may not sound like a major concern. In practice, small delays compound quickly. Here are some realistic examples of request latency:
- Sydney to Melbourne: 5ms
- Sydney to Perth: 25ms
- Sydney to San Francisco: 75ms
NOTE: Common tools used to determine latency between servers are Ping and Traceroute, they will provide you with Request Round Trip (RTT) latency, ie the time it takes for a request to get to the server and back. So 2 times the numbers above.
Here is an example of latency during a webpage load. We'll ignore internet speed and any potential network congestion, and focus only on latency. We'll request a website hosted in San Francisco from a browser located in Sydney.
- Browser establishes a TLS (Secure) connection with server, 6 * 75ms = 450ms
- Browser sends HTTP Request for the main page = 75ms
- Server sends HTTP Response containing page which specifies 10 assets = 75ms
- Browser requests the 10 additional assets = 75ms
- Server responds with 10 assets 10 * 75 = 750ms
In this example, a website with 10 assets, which is a fairly simple page, has nearly 1.5s added to the page load time through latency alone. If the same site was hosted in Melbourne, the time due to latency would be just 95ms. To solve this problem you would either move your website server closer to your customers, or use Peakhour Edge caching.
How do I check for latency problems?
If there is a long distance between your server and your customers, eg your website is hosted in the US and your customers are in Australia, page load times will be significantly affected by latency. A good tool for indicative RTT times between cities is provided by wonder network. Webpagetest.org also provides a Traceroute tool which can give you indicative RTT times between its testing locations and your website.
2. Old version of HTTP
Browsers communicate with websites using a protocol called HTTP. The protocol formalises the steps needed to connect a browser and server so a webpage can be downloaded. Since the introduction of the web, HTTP has gone through a number of revisions. The currently widely adopted version is HTTP/2.
Even though HTTP/2 was introduced over 5 years ago, over 50% of websites are still only served over HTTP/1.1. Without getting too technical, HTTP/2 has significant advantages over older versions because it reduces the number of connections between a browser and server, and transfers information more efficiently.
Serving your website over HTTP/2 can improve page load times by 10-15%.
How do I identify the version of HTTP my website is served over?
Run a performance test of your website using WebPageTest.org, once complete click on the 'Details' link in the report navigation. You will see the Waterfall View. Click on the first request, circled below in this image:
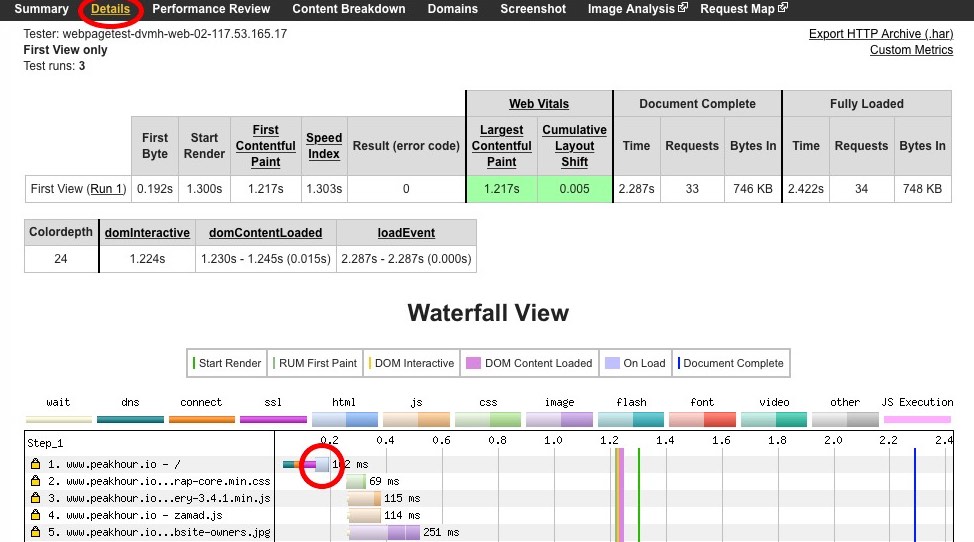
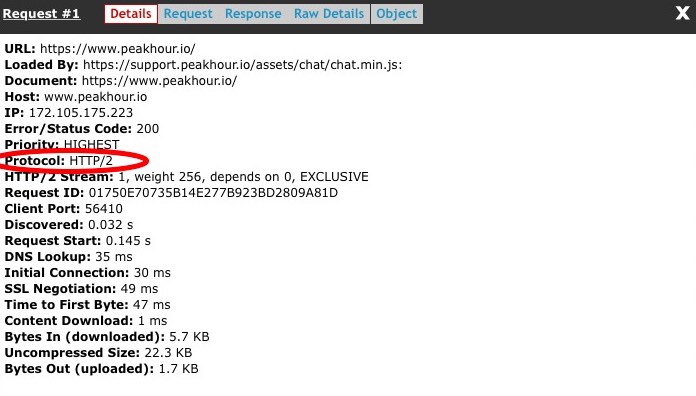
It will bring up the request details including the Protocol used, circled below:
3. Slow Server Performance
A slow initial response from the server is a common cause of poor page load performance. The majority of websites are built using some sort of Content Management System (CMS), eg Wordpress, Magento, Drupal, Shopify, to name a few. By default, a CMS has to construct a page each time a browser requests it, even when the content has not changed. That process can involve executing a lot of code and querying a database several times before returning the HTML that forms the page.
The specification of your server, the number of CMS plugins, the state of your database, and the number of simultaneous users can all affect the response time. A slow server may take 10s or more to respond, while even a fast server can still take over a second to generate a page. That is enough to pretty much make you fail the new Core Web Vitals guidelines before you even get started.
How do I check for slow server performance?
Server performance can be checked from the waterfall view in WebPageTest.org. The time taken to download the main document indicates whether server performance is affecting your page load. Here's an example:
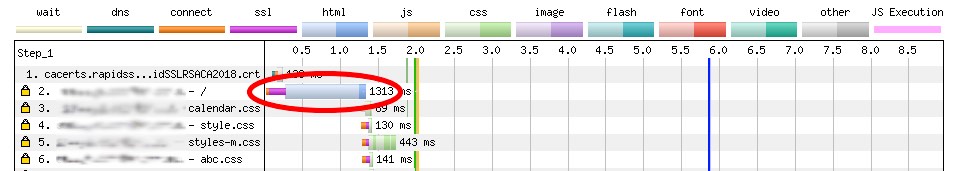
The total time taken to download the main document here is over 1.3s. That is not too bad, but it has already used up over half the 2.5s required to achieve 'Good' for the Largest Contentful Paint (LCP) metric in web vitals
4. Page Weight
Even though internet speeds are getting faster, they are still a limiting factor to how fast a browser can download a page. If the requested page and the associated resources, eg images, javascript, CSS, are large files, it will take longer for the browser to download all the required information to display a page. Unoptimised images are a common culprit for inflating page weight. Unoptimised CMS themes and third party javascript libraries are another.
How do I check my page weight?
WebPageTest.org reports the page weight in the far right of its summary, circled here:
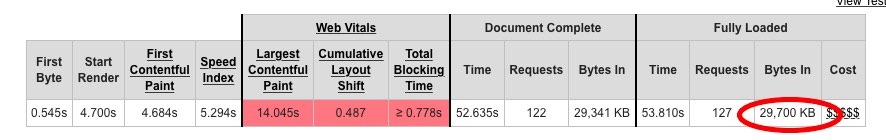
You should be aiming for 2mb or less. This particular website is more than a little obese, coming in at around 30mb... WebPageTest also has a section called 'Content Breakdown' which shows where the weight is, ie in images, javascript, etc.
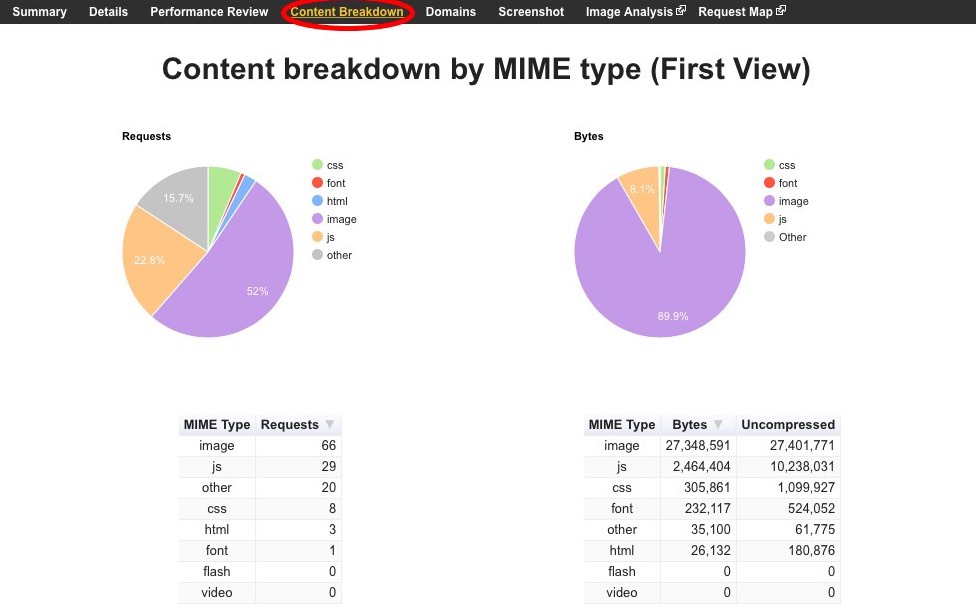
Over 27mb in images is what's weighing down this page.
Peakhour also has a pageweight tool that you can run for a page on your website and receive a full optimisation report for the images on the page, along with downloadable optimised images.
5. Blocking Resources
Resources that can block a page include CSS and javascript. When the main HTML page is downloaded and parsed, the browser will not render anything to the screen until the CSS and javascript files that are referenced are downloaded and parsed. If your website includes a lot of CSS and javascript, which is not uncommon for pre built themes for CMS's like Wordpress and Magento, the downloading and parsing of these files can delay the browser from showing any content for several seconds.
How do I identify blocking resources?
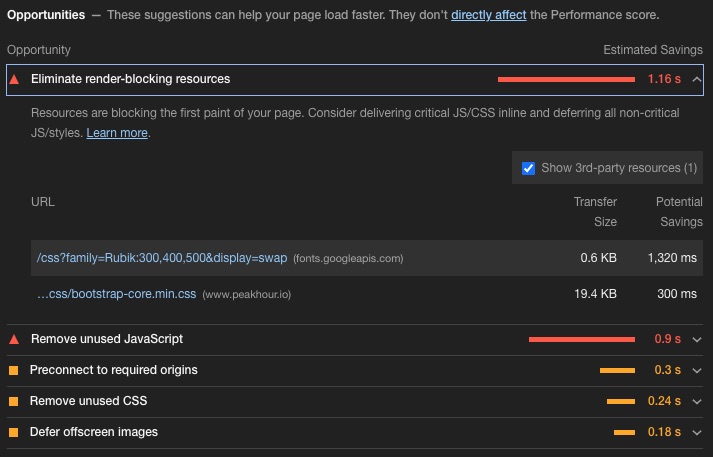
The easiest way to check is to use Google Lighthouse) to identify them for you. After running the report, go to the opportunities section and expand the 'Eliminate render-blocking resources' section to see what it finds.
6. Third Party Resources
It is very common for websites to include third party resources. These are files that have to be fetched from a domain/url other than the one that the page is being requested on. Eg if you are requesting www.domain.com.au, it might include a resource from a third party, eg www.anotherdomain.com.au. Common third party resources might be analytics scripts (eg Google analytics), marketing tools (eg Mailchimp)
This forces the browser to open another connection to the third party. The time taken to do this, combined with the possibility that the third party might be slow to respond (see latency and server performance above), can often ruin load times. If the resource in question is also a blocking resource the problem is compounded.
Spotting a problem with third party resources
WebPageTest has a section 'Domains' which displays all the individual domains that the browser connected to when loading the page:
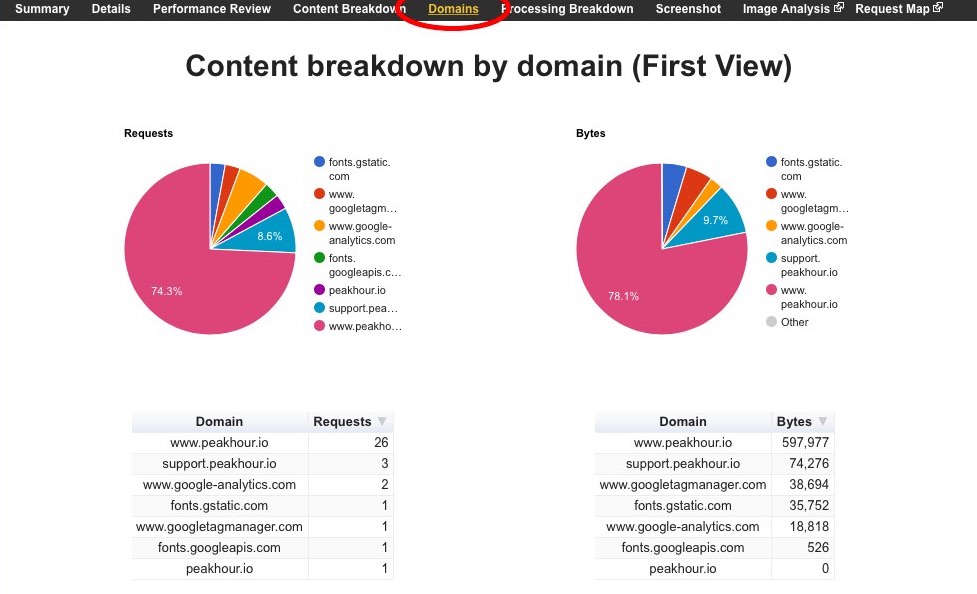
If your website is requesting resources from more than 10 separate domains then you should consider why that is happening and whether they are necessary. If you are using external CDNs to load javascript or CSS then you should probably move them onto your domain.
Social sharing plugins are notorious for pulling in a lot of resources from external domains. You should replace any share buttons using external scripts with simple static buttons. It is simple to do, and your website will be much smaller and faster. By using the javascript shares that social sites prescribe, you are slowing down your website and allowing third parties to track your clients across the internet.
Conclusion
There are many factors that can slow down your website, drive away customers, and cost you money. You have to regularly test your website to check for issues and address them when you find them. Next we'll cover what you can do to fix the issues we've mentioned here.