Introduction to Website Performance Testing
Speed matters, even milliseconds count on the Internet when it comes to website performance. A poor page load experience can affect everything from user bounce and conversion rates to search engine ranking. Understanding the key website performance metrics and tools to evaluate page speed is the first step to providing the best experience for your users.
The Case For Testing Site Speed
So is it worth the time to test your website speed when it comes to load times? According to these statistics, testing website performance is more important than ever:
- A one-second delay in page load time decreases page views by 11 percent with conversions dropping by 7 percent and customer satisfaction by 16 percent.
- 53 percent of users abandon sites that take longer than three seconds to load.
- The BBC reported that they lost an additional 10 percent of users for every additional second their site took to load
- 52 percent of online shoppers report that quick loading speeds are important to brand loyalty. When traffic was at the peak, 75 percent of consumers would jump to competitor sites instead of bearing with a slow loading page.
- Pinterest reduced perceived wait times by 40 percent thereby increasing search engine traffic and sign-ups by 15 percent
- Unbounce found that almost 70 percent of consumers feel that page speed impacts their willingness to buy from an online retailer.
- Over half of site visits are likely to be abandoned if pages take longer than 3 seconds to load, says Google. And half of website visitors expect a page to load in less than 2 seconds. For mobile users, waiting for pages to load is what they dislike the most when browsing the web.
The research and data is clear! speed is critical for the best browsing experience, both on desktops and mobile devices.
Testing your website
Hopefully you're convinced that site speed is important, the first step to improving your own website speed is evaluating its current state. To do that you'll have to use a performance testing tool, which fall into two categories.
Synthetic/Lab Testing
Synthetic tests measure page performance in a 'laboratory' environment. Geography, network speed, device, browser, and cached status are predetermined, and kept consistent between measurements. By controlling the environment it can be easier to identify the source of any performance issues. More advanced testing might involve automating a typical visit to the site, simulating multiple page views/purchase like a visitor would. Any tool where you enter your domain name, and it gives you back a report, will be a synthetic test.
Real User Monitoring (RUM/Field) Testing
Real User Monitoring, or RUM, is a method of measuring performance of the real users of a website. To gather measurements, a snippet of Javascript is injected/embedded in the target page, this records the page load and reports back the information to a server for analysis. RUM helps identify how a website is being used, the geographic distribution of its users, and the impact of different variables on the end user experience. Google analytics is an example of RUM.
Synthetic vs RUM
Both types of testing have their place and are both vital to have in place. Synthetic testing is easy, cheap, and well suited for developers catching performance bottlenecks early.
RUM, on the other hand, is harder to setup and usually requires a paid for service. However, it can provide vital insights into how real users see your website. For example, you may have optimised for a desktop at cable speeds when 70% of your real users are on mobile devices. Or your server may be in Sydney, but the majority of your customers are overseas, meaning you should utilise a CDN.
What should you be measuring?
Over the years the focus of measurements has gradually changed. Testers originally focused on browser events like:
- DOM Loaded: the time taken for the browser to parse an HTML page
- Page Loaded: the time taken for the browser to finish downloading and processing all the content on a page.
However, these browser events don't necessarily capture the user experience of a page loading. The Page Loaded event, for instance, may not fire for several seconds after all the content on a page has been displayed. Conversely, nothing might be displayed for several seconds after the DOM has loaded due to Javascript execution.
This led to the introduction of metrics that measured visual changes, one of the first and most influential was speed index, introduced by webpagetest.org.
Just recently Google introduced Web Vitals, their own recommended metrics for measuring performance. Considering that the core Web Vitals are now search signals for Google's organic rankings, its pretty safe to say that you should be benchmarking your site using the Web Vitals metrics.
Popular Testing Tools
There are a multitude of tools on the web that offer to test/analyse your website performance. However not all are created equal, some test different very narrow aspects, some just aren't useful at all, and they all choose their own criteria when marking your site. If you were to compare performance scores between two different testing tools the scores might vary wildly. With that in mind let's introduce some popular free tools:
Pingdom

Pingdom offers a free tool called the Pingdom Website Speed Test. You can test any site and have the option of choosing from several testing locations around the world, but you can't select a device/browser or connection speed. The report provides a useful breakdown of the resources/content on the page and a performance score out of 100. Unfortunately as part of the test it issues a no-cache header when requesting the page, this means any analysis is not going to take into account any proxy caching you have in place. Its scoring out of 100 is also opaque, ie it does not give you the detail of the resources that cause poor scores, more often than not these are off domain resources like google analytics that lower your score. Our thoughts are that the tool is of limited value, it is more a gateway to Pingdom's paid for services which include uptime monitoring and RUM.
Gtmetrix

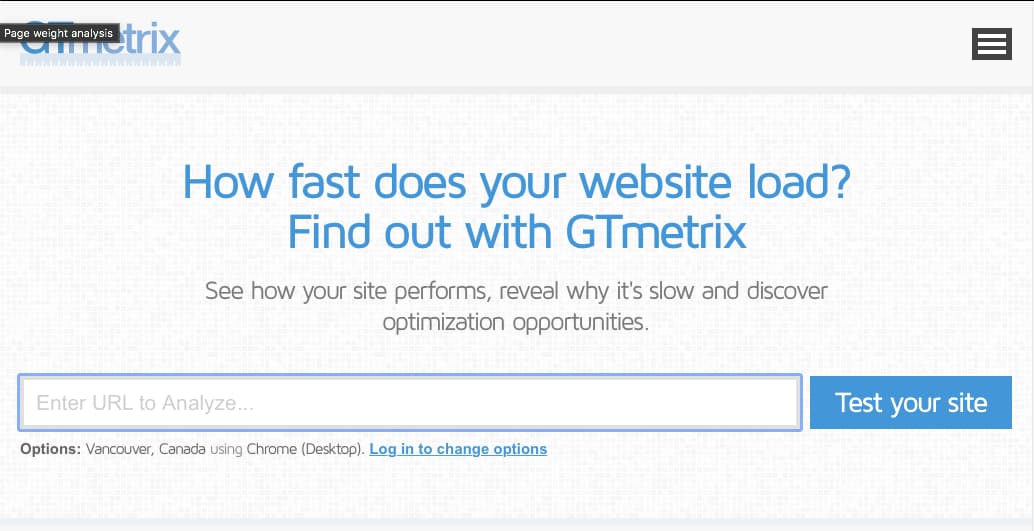
Gtmetrix integrates both Google's legacy PageSpeed Insights and Yahoo's YSlow to provide performance metrics. If you create a free account you can view recorded responses across multiple devices, track page performance over time, and simulate tests with ad blockers enabled, connection throttling, and REST APIs. The report provides much more detail with its scoring than Pingdom but on the downside, PageSpeed and YSLow are out of date and not reporting against current best practice.
Google Analytics

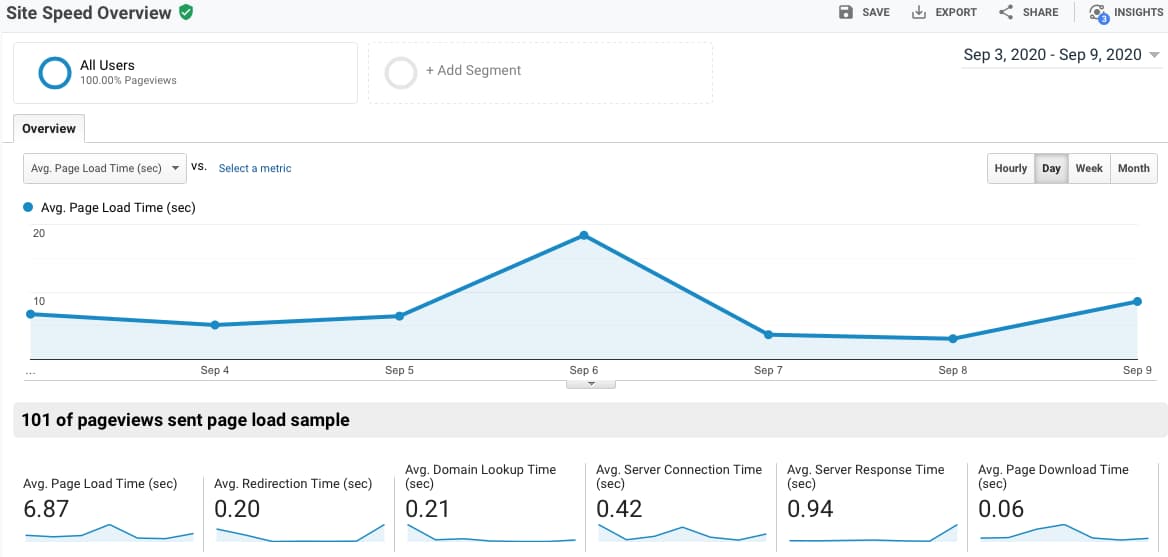
Google Analytics has a Site Speed report under its Behaviour section. The report gives you a number of load timings broken down by page. While it looks great, its not very useful and shouldn't be relied upon. Problem 1 is that the metrics reported don't give a good overview of user experience, and problem 2 is Google only samples 1% of pageviews for speed timings, this can result in very unrepresentative figures. See Joe Christopher's post on analytics accuracy for a good overview of why you can't trust the Site Speed report in Google Analytics.
Tools we use
The tools we use here at Peakhour are Webpagetest.org and Google Lighthouse. We will cover these tools in more detail in future posts.
WebPageTest.org

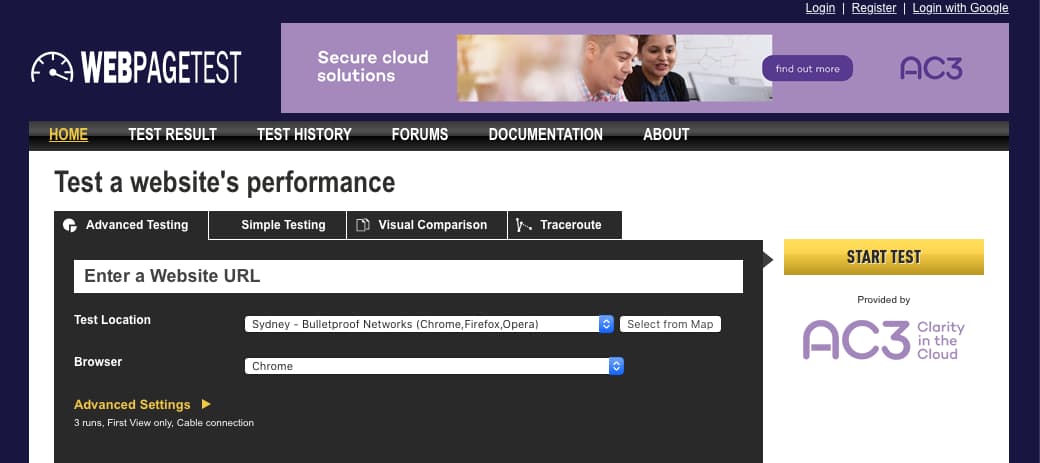
The advantage of using WebPageTest.org is that tests can be run from multiple global locations using real browsers at actual connection speeds. Users can also customize the tests, including conducting simple tests, advanced multi-step tests, video capture, and content blocking tests. Its default settings give a great picture of a visitor hitting your site for the first time and provides all the page load information that you need to diagnose issues as well as the new web vitals and their own speed index.
Google Lighthouse

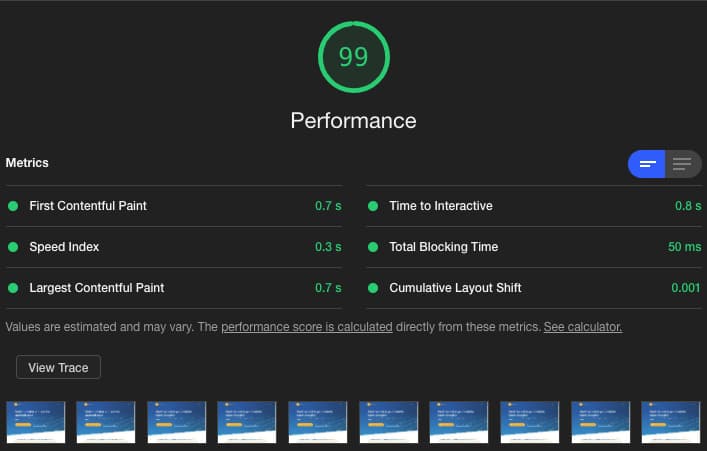
Lighthouse is available in Chrome DevTools, npm or as a web browser extension in both Chrome and Firefox. Lighthouse is also the engine behind web.dev/measure and PageSpeed Insights. It also audits performance, looks for best practices, and checks for accessibility and SEO best practices. We mainly use it for its identification of blocking/unused resources, and the ability to see Google's field data collected from real users.
We do however recommend running the report locally in your own browser. The Google Hosted versions at web.dev/Pagespeed Insights run out of the US, if your site and customers are in another country then your scores will be negatively impacted by the extra network latency.
Summary
Speed is critical for the best browsing experience, both on desktops and mobile devices. If you're not convinced just remember page speed also affects everything from search engine optimization to online conversion rates. The faster your site is, greater the chances for success. To get started with testing read the next two articles in this series on website performance, testing with WebPageTest.org, and testing with Google Lighthouse.


